Some new tricks for CodeTrack

CodeTrack has become pretty good at tracing .NET processes, if you haven’t tried it out: get your copy on getcodetrack.com and give it a go (it’s free !).
I assume you already heard about it, but if you didn’t here’s a 1 minute overview:

The latest release now supports plugins and deeptrace rulesets. This allows you to fine tune exactly which info you want to capture and then show this in a way that’s very specific for your use case.

This might still be a little bit abstract so let me explain this by giving an example.
In the latest version there’s a plugin included out of the box that allows you to capture all output to the console and show that back to you while analyzing your data.
This allows you to just scroll through your output, select a particular line in your output and jump straight to that location in the timeline. This way you can easily filter out a particular moment in time where something interesting happened.

So how is this done ?

  • First a ruleset was created that specified which methods manipulate the console output, like so:
    console_ruleset
    As you can see, there are many including the ones that change the console colors.
    Also notice how some methods have ‘Trace arguments’ enabled. If these methods get called, CodeTrack will also capture all arguments for that method and the return value.
    In this case the arguments are really simple: just some strings and an enum for the consolecolors. Sometimes the arguments you care about are objects and in those cases you can use the fields tab and specify which fields of which types you want to be captured.
  • Secondly a plugin was created to put this captured data to use and reconstruct the console output to the screen.

You can find the code for this plugin on the github page : CodeTrack Plugins On Github

To see the result in action check out this small video:

I Need your help

I hope that by now you understand the huge potential this has got: you can easily create rules about what to trace and you’re able to extend CodeTrack to use this data the way you want.

I’ve got lots of ideas for stuff to build:

  • A plugin that exports specific data out of your trace
  • A plugin that show you some nice statistics about your performance
  • A ruleset and plugin that allow you to capture trace output and or log files (eg. with support for Log4Net, NLog,…)
  • Rulesets and plugin for info about DB queries (eg. with support for RavenDb, Entity Framework, MongoDB, Redis, …)
  • Rulesets and plugin specific to Web development
  • A ruleset and or plugin that helps you understand why an assembly couldn’t be loaded (like fusionlog but easier to use/understand)
  • Plugins and rulesets to better show async behavior (and maybe also threading, locking, etc…)

Unfortunately I don’t have the time to build all of this, and I don’t know enough about these things, to decide on what methods and fields are important to trace. I’m not just talking about ‘performance-wise-interesting’, I also mean functionally (eg. in case of a web specific scenario things like: why -or why not- was a certain method called on my controller ? Which route did it take and why ?)

So I’m hoping there are people out there who know lots of stuff I don’t know (that should already be a whole bunch ;-)) and that are willing to spend some of their time to help me out by

  • Listing all interesting methods, arguments and fields for a particular scenario
  • Write plugins for codetrack
  • Providing small samples that can be used to test a particular case
  • Or maybe come up with some other interesting ideas

So are you and ASP.NET expert or an async-await-whizkid with some free time ?
Please let me know (info@getcodetrack.com) and maybe you can help me out !

Of course all plugins and rulesets will be shared for free!

For more info on writing plugins check the documentation on getcodetrack.com


The rocket tale (Part II): Look at the time !

In this post I’ll try to explain what’s difference between all the different timing modes that CodeTrack provides. I’ll be using the same analogy as I did in part I, so if you didn’t read that yet: please go and do that first. Otherwise this will make no sense at all 🙂 (go ahead, I’ll wait).

Hi Res Wall Time

So let’s assume you’re the tracing expert again, and you walk into the factory to go and write down some timings. For the sake of simplicity, we’ll just trace 1 assembly line.
At the assembly line only 1 worker can actually do work and they have to wait to start doing their task if the previous worker completely finishes his own task.
The most obvious way to write down the time, is to go and read it from a clock that hangs at the wall of the factory entrance. This is what we will call Hi Res Wall Time.

18cd0b51ed68ed9f0ea5e9e857707fc0

Overhead

So now every time John Doe starts  producing a screw, this is what happens (let’s put some actual timings next to every event):

  1. John leaves his working post and comes to tell you he’s going to make a screw (10 seconds)
  2. you get up, run to the factory entrance, look at the time (1 minute)
  3. you run back to the assembly line (1 minute)
  4. you write down the time (10 seconds)
  5. John goes back to its working post (10 seconds)
  6. John starts his task (1 second)
  7. John produces a screw (10 minutes)
  8. John finishes his task (1 second)
  9. John leaves his working post and comes to  tell you he finished a screw (10 seconds)
  10. you get up, run to the factory entrance, look at the time (1 minute)
  11. you run back to the assembly line (1 minute)
  12. you write down the time (10 seconds)
  13. John goes back to its working post (10 seconds)
  14. John or one of his colleagues can now start again at 1)

It might seem a little exaggerated to split it up in such small subtasks, but most of these impact your tracing overhead (and thus your result).  So in total you’ve spent 2 minutes 31 seconds before the actual production of the screw and the same amount after the screw was finished. So 5 minutes 2 seconds overhead for a production time of 10 minutes.

You can clearly see, John will produce far less screws when you’re around 🙂

speed-slow-snails-ss-1920-800x450

Jim, a colleague of John working at the same assembly line, assembles the rocket with the screws John produced. This task takes 4 hours. So you might think that for Jim, the overhead will be so relatively small that it can be ignored.
Sadly, that’s not completely true. If a worker (Jim) depends on other workers (John’s screws), the overhead can turn into a real avalanche effect since every overhead for measuring sub tasks will be added to the parent tasks as well.
Not only does the factory slow down, it also might give a completely reversed view of Jim’s actual performance. It might look as if it took  Jim ages to screw together rocket parts, because John had to make 100 screws each with their own overhead. So this means that Jim already inherited Johns overhead (of 100 x 5min =8.3 hours), before he even started !

(Lo Res) Wall Time

Obviously the CEO doesn’t like the overhead you’re introducing, and Jim isn’t happy either. So what can be done about it ? We could try to reduce the overhead by not running back and forth to the factory entrance clock.

Wstressed-male-office-worker-holding-overtime-clock-overloaded-businessman-standing-modern-flooded-paper-work-over-time-30450754e cannot move the clock to the assembly line, but what we can do is hire a clock assistant. The clock assistant will constantly run back and forth between the factory entrance and the assembly hall. In the assembly hall is a huge whiteboard, were the assistant will write down the latest time.
This will drastically reduce the overhead of the tracing expert. As with everything in life, this comes with a cost: accuracy. The whiteboard wall time will at least differ with the entrance clock with a value of the duration of  1 assistant-round-trip.

Overhead Compensation

If the CEO doesn’t care for the factory slowing down, there’s another solution to our overhead problem (at least to the issue Jim is having). We can measure how long the events before and after a task (marked in blue) take and then subtract this overhead from the measured time. Of course we also have to subtract this overhead from all parent tasks as well.
I see you rolling your eyes and saying: “OK wiseguy, and how am I going to time the overhead of taking the time, that will take even more time !”. Correct! You could run back and forth to the clock and then subtract the 2 timings. This will give you an idea about the duration of taking the time. This will always be an estimation though, because there’s no guarantee that each round trip will take the same time. If we would do this for every measurement, the overhead will increase even more, so we could just do this every once in a while and then use the latest estimation.
Unfortunately the orange events cannot be compensated, because you’ve got no idea of the exact moment that John leaves or returns to his working place. Luckily, this overhead is quite small.
We could also do a combination of Lo-Res wall time and overhead compensation. The question is: Given the fact that 1 single overhead probably takes less time than the assistant-round-trip does this make any sense ?  I’m guessing not so much 🙂

Thread Cycles

Now imagine you have several assembly lines each peacefully minding their own business.
One assembly line (A) creates engine screws and assembles the engine. The other assembly line (B) assembles the rocket from the major parts (one of which is the engine).
Once assembly line B gives the order to produce an engine to assembly A, it needs to wait for A to finish. The complete task of assembly line A took 10 hours, assembly line B worked for 4 hours creating the assembled engine.
If you would be using the wall time method, it would look like assembly line A worked for 10 hours, while they were actually just waiting for 4 hours and really worked for 6 hours.

This is were Thread Cycles can help you out. Every 5 minutes, each assembly line teamlead needs to notify the accountant department how many minutes they have been really busy. You can request this information from the accountant department, but this department is a 10 minute walk away from the assembly hall. This will induce an unacceptable overhead. That’s why you have a tracing assistant running back and forth from the assembly hall to the accountant department. Just like with the wall time, this timing will be written on the whiteboard.

If you use this timing, the report will show how much time was spent while actually doing useful work. Although you need to take in account that these timings will not be 100% accurate.


BOOM !

If you would just do your tracing and at the end of the week walk out of the factory when it closes down for the weekend, you can hand over your report to the CEO. Done !

But imagine on Thursday evening the rocket factory explodes with an enormous bang and everything is turned to shreds (including you). The CEO will never know what was going on when the factory exploded.

2a94ac0f00000578-3163988-other_than_the_two_fire_fighters_who_were_injured_while_trying_t-a-58_1437064985683
Thats why every 30 minutes, a sub report is sent out to the tracing headquarters. This way the CEO might see what the reason of the explosion was. Unfortunately, sending this subreport again creates another overhead. I’m guessing, this is one the CEO is willing to take.

Conclusion

Let’s see what the analogy represents in the real world:

  1. John leaves his working post and comes to tell you he’s going to make a screw (10 seconds)
    • The CLR calls into an enter method hook
  2. you get up, run to the factory entrance, look at the time (1 minute)
    • CodeTracks profiling code is called and the PerformanceCounter is queried
  3. you run back to the assembly line (1 minute)
    • The Performance counter returns the current CPU clock cycles
  4. you write down the time (10 seconds)
    • CodeTrack does it’s thing and sometimes flushes data
  5. John goes back to its working post (10 seconds)
    • The CLR returns from the enter method hook
  6. John starts his task (1 second)
    • The actual method is called
  7. John produces a screw (10 minutes)
    • The actual method runs
  8. John finishes his task (1 second)
    • The actual method is done
  9. John leaves his working post and comes to  tell you he finished a screw (10 seconds)
    • The CLR calls into a leave method hook
  10. you get up, run to the factory entrance, look at the time (1 minute)
    • CodeTracks profiling code is called and the PerformanceCounter is queried
  11. you run back to the assembly line (1 minute)
    • The Performance counter returns the current CPU clock cycles
  12. you write down the time (10 seconds)
    • CodeTrack does it’s thing and sometimes flushes data
  13. John goes back to its working post (10 seconds)
    • The CLR returns from the leave method hook

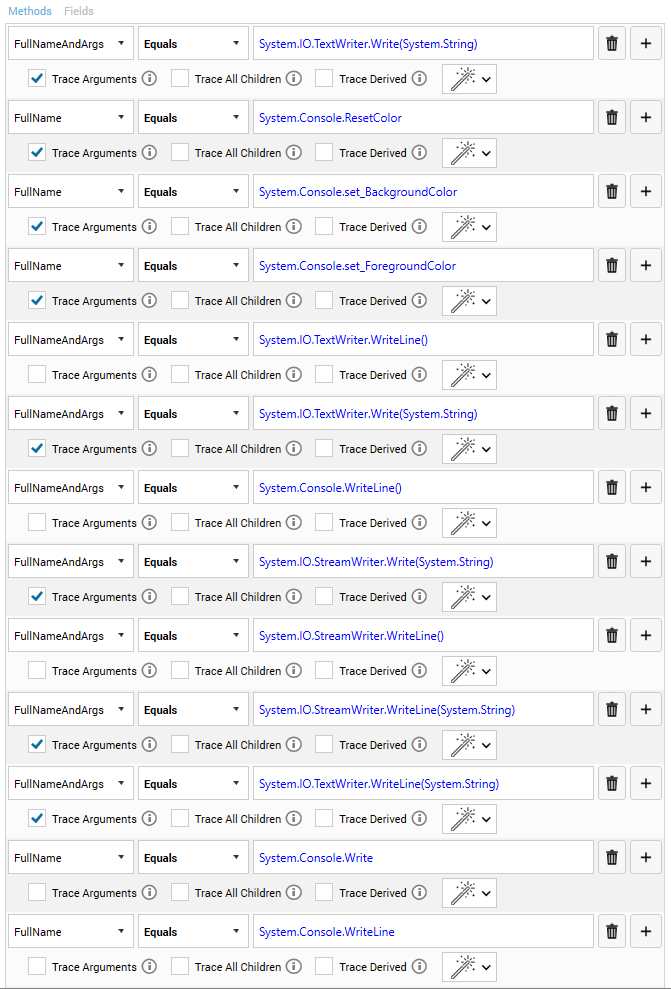
CodeTrack offers all these advanced settings, so you choose the exact options you want.
They all have their specific properties and usages. You can find them while setting up a new session (Collect tab), in the options step under the ADVANCED expander:

profiling_options

If you don’t select any timing options, CodeTrack will go with Lo Res walltime.
You can select multiple timing modes (Hi/Lo res + Overhead Compensation + Thread Cycles) and then switch back and fourth between all measurements in the analysis phase.

Now you’re ready to go and build some rockets…

Get your free copy at www.getcodetrack.com
If you have any (codetrack) issues, feel free to let me know !
If you like it: please share with your fellow rocket-CEOs.

twitter_bg

Profiling Overhead

The tracing part of CodeTrack v1.0.0.7 has been completely rewritten in order to reduce the profiling overhead as much as possible, while still giving you the option to enable certain measurements if you need them.
By doing this the profiling overhead has been greatly reduced. In this post I’ll show you exactly how much faster CodeTrack has become and also what the effects of the different settings are on the overhead.

The Sample Code

For measuring the overhead I just wrote a very simple console app : 

[MethodImpl(MethodImplOptions.NoInlining)]
private static int MethodA()
{
	return 2;
}
[MethodImpl(MethodImplOptions.NoInlining)]
private static void MethodB()
{
	for (int i = 0; i < 10000000; i++)
	{
		MethodA();
	}
}
static void Main(string[] args)
{
	Int64 sum = 0;
	Stopwatch tot = Stopwatch.StartNew();
	for (int i = 0; i < 50; i++)
	{
		var sw = Stopwatch.StartNew();
		MethodB();
		sw.Stop();
		sum += sw.ElapsedMilliseconds;
		Console.WriteLine(sw.ElapsedMilliseconds);
	}
	tot.Stop();
	Console.WriteLine("Total: {0}, Inner Sum: {1}", tot.ElapsedMilliseconds, sum);
	Console.ReadLine();
}

Nothing to fancy, as you can see 🙂 It’s just a method being called a gazillion times.

If I run this app I get:

baseline

So you can see that excuting MethodB 1 time takes 945/50 = 18,9 ms. We’ll use this as our baseline.

V1.0.0.7 vs V1.0.0.6

Just to prove I’ve been doing some useful work, let’s trace this with V1.0.0.6:

1006_tracing

Since this took ages, I didn’t wait for the app to finish, but you can see now this takes about 8100 ms per iteration.
If do the same thing with V1.0.0.7 we get:

results_a

That’s 391 ms per iteration (so 20 times faster, not bad 🙂 )

Options, options, options

In the advanced expander in the tracing options you can pick exactly the options you want for your tracing session (A blogpost about the differences will follow soon).

In this summary I’ll show you the same measurement for different settings:

No options enabled: 391ms
Hi resolution: 466ms
Hi resolution + thread cycles: 509ms
Thread cycles: 454ms
Hi resolution + compensation: 565ms
Generics: 786ms
Timeline + Hi resolution: 6903ms

Another (non-free) famous profiler*: 427ms

*I don’t want to start throwing mud here, so I’ m not going to tell which one it is. Live and let live! I just want to prove that CodeTrack has grown and can deliver professional results.

Of course these measurements depend heavily on the kind of code you are executing, but I think it gives you an idea about how performant CodeTrack has got.

cropped-twitter_bg.png

Don’t take my word for it, go get your free copy and check it out for yourself at
www.getcodetrack.com

The rocket tale (part I): Sampling vs Tracing

In this post I’ll try to explain what’s the difference between sampling and tracing. At first it might not seem very important, but if you really want to understand what your code is doing, there are some subtle differences that can set you on the wrong path. I’ll try to not make it too boring by explaining it with an analogy…

A rocket tale

Imagine you’re hired as an expert by a company that builds rockets (’cause who doesn’t like rockets? 🙂 ). The rocket CEO isn’t happy with the amount of rockets produced and wants you to figure out what’s the bottleneck. They have a huge factory with hundreds of employees each doing their own little task. Some of them only produce screws to keep the rocket together, others assembly all parts with the screws their coworkers created. The factory contains several assembly lines, each producing their own parts.

185207350

The sampling expert

If you would take the sampling approach, you would walk into the factory on a regular basis (let’s say every hour, for a whole week), you’d sound a buzzer and all employees should immediately stop with what they were doing. Great so now you have a factory full of statues. You run around the factory and very quickly take a picture of every assembly line. Now you know what every employee was doing at that exact time. When you’re done, you sound the buzzer again and everyone goes to work again like nothing happened.

By the end of the week you could tell the rocket CEO some very useful information:

  • at every assembly line, what is it that employees seem to be doing most of the time ? (so if you can speed up this particular job, the rockets would probably be ready faster)
  • which employee seems to be working the hardest ? (some would be doing nothing at the time you froze the factory)

Also quite important: by doing your investigation you didn’t have a very big impact on the productivity of the employees (in other words: just as much rockets shipped that week, like they usually do).

7dd787576056c26bb135fc722ff0e5c1

The tracing expert

The CEO is already pleased with the results, but wants you to dig deeper.

So you put on your tracing expert helmet and walk into the factory again. This time there’s no buzzer but you brought a few of your friends (who also happen to be tracing experts, whats the chance ? 🙂 ).
You position a friend at every assembly line in the factory. Now every time a rocket employee starts doing a certain task, they first need to notify your friend at their assembly line. Same thing goes when their task is finished. Your friend meticulously notes down the time whenever such an event happens, together with the kind of task.

By the end of the week you’ve got lots to report to the CEO:

  • How many times did an employ execute a task at every assembly line ?
    (eg. how many screws did John Doe produce at assembly line X ?)
  • Exactly how much time did a certain employee took to complete a task at every assembly line ?
    (eg. how much time did John spent, actually producing screws)
  • How much time was an assembly line doing nothing (for instance, while waiting on screws to be produced on another assembly line)

If the tracing expert was told to write down lots of information you also might be able to tell:

  • What kind of screws did John make, and exactly how many of many of each kind ?
  • Which orders did John get ? And what did he report to his superior when he finished a task ?

As you can imagine, the second time you visited the factory, they didn’t produce as many rockets as they usually do, since the employees had a lot of waiting to do for you and your friends to write down all this information. When the highest level of detail was required, this only got worse and they didn’t even finish one small rocket.

So the CEO got lots of detailed information, but this time this really impacted the production that week.

I like the sampling guy the best

Well probably the CEO liked the sampling expert a lot more, since he nearly didn’t impact production. But let’s look at a few things that the CEO probably should take in account when optimizing his factory :

factory worker sleeping on the job

  • Assume we took a picture every hour, and in only 5% of these pictures John Doe was making a screw. In all the other ones, he was leaning back on a chair sipping from a soda.Would it be wise for the CEO to conclude that John is a lazy no-good ? Well, it might be, but there’s still a good chance that John was working very hard in between the taking of the pictures. We’ll never know for sure.
  • Even worse: if John had to make one very important rocket part (which takes him 5 minutes, but after that he’s really tired), and in none of the pictures was making this part, can we conclude that the part never was made ? Obviously, we can’t.
  • If john was making a screw at every picture. Does this mean he made an awful lot of screws (hooray for John) ? Or does it mean he made one screw, and it took him ages to complete it  (boo for John) ? Again: we’ll never know.

Ok got it, sampling is bad

Well no, that wouldn’t be entirely true either 🙂 Sometimes you simply cannot hire a tracing expert, since production really needs to go on.
In that case, sampling might be helpful. Just keep in account the previous paragraph and be very careful when jumping into conclusions.

What you also can do is hire a sampling expert first, and then later send in the tracing expert telling them what to focus on. For instance: don’t hold up the guys painting the rocket and assembling the engine, but keep an eye on John and his screws…
This way you don’t have big impact on production and you get to find out the truth about John.

Conclusion

As you probably have guessed, the rocket factory is your app and you’re the CEO (congratulations on that, owning a rocket factory is pretty impressing Elon 😉 ).
The assembly lines are the threads in your factory and the employees doing a task are your methods.

Sampling and tracing both have a very good reason to exist, and they are both very helpful. Just be aware of the subtle differences. Use them wisely and your factory will be pushing out rockets like you wouldn’t believe.

Unlike other tracing experts,CodeTrack allows you to specify a detailed filter before tracing. So you can just watch John and his screws, instead of the whole factory.

I sincerely hope you give CodeTrack a chance to be your sampling/tracing expert.
There are lots of other tracing experts out there, but they’ll be a lot more expensive 🙂

What’s in part II ?

There are a lot more subtleties left to talk about: How do you take the time ? How much time does it take to take the time ? What impact does this tracing expert really have on the rocket factory ? Can we hire a tracing expert to trace the tracing experts ?
We’ll even think about what time really is (get your philosophy belts on 🙂 )
And while we’re at it, we’ll also look at what happens when a rocket factory explodes (promised)

Get your free copy at www.getcodetrack.com
If you have any (codetrack) issues, feel free to let me know !
If you like it: please share with your fellow rocket-CEOs.

cropped-twitter_bg.png


New version released!

It’s been a long while since a new version was released, but now I’m very happy to announce the release of CodeTrack v1.0.0.7 !

hooray

The tracing part of the profiler has been completely rebuilt from scratch. By doing this the performance has been extremely increased (more on that later).
Also lots of new stuff has been added like hi resolution timing, overhead compensation and thread cycles (I’ll try doing a blog post soon to get into more detail).

“Why did this take so long?” I hear you ask. Well I literally have been right here:

lkvck

And several times right there:

jill-greenberg-end-times-children-crying-4

But hey : in the end everything turned out just fine, I’ve learned a lot and most importantly: CodeTrack has improved big time 🙂

Get your download now at http://www.getcodetrack.com and let me know what you think !

PS. No worries : it’s still FREE !!!

Why would I Use Codetrack ?

Well the obvious answer would be: “if you wrote this magical piece of code and it turns out to be unexplicably slow”

58809905

While that’s a correct answer (after all: it’s free and it’ll point you in the right direction, nothing to loose right ?), there are some other less obvious scenario’s why Codetrack might be your new best friend.

Let me tell you about a few:

The one were your code acts weird and your hands are tied
(aka: the ‘please kill me now’ moment)

Every developer  sometimes has this piece of code that works fine locally and for some reason it just doesn’t when you deploy it on a production server or at your clients machine.
Of course, karma doesn’t stop there: on these machines there’s no debugger and you’re not allowed to install one. Remote debugging ? Nope: firewalls all over the place and security won’t allow you to bypass them. Oh and did I mention you get 15 minutes tops on the server/pc ?
That’s where Codetrack might just save your day. There’s no installation required, you can just copy paste it to the evil machine do your thing and leave without a trace (pun intended).
Of course you’re not going to be interested in the performance this time, you want to enable the timeline feature and if needed include arguments. You can start by just tracing your own code using the filters, and if necessary retry tracing all methods (including the .NET FW itself)

profileprocess03

You can even pause the tracing when starting your app and hit record right before things start to go wrong (so you don’t drown in all the data afterwards).

If all goes well you can now literally browse through the execution of your code, zooming in on every interesting call and check what arguments and returnvalue it has.

analyze_properties

By the way: there’s no need to do it on the machine on which you took the trace, you can just as well do it on your own laptop, with a soothing cup of joe.

This scenario happened to me quite a few times, and I was always able to find the cause of all evil using Codetrack.

The one where your breakpoint doesn’t get hit

A while ago there was a new colleague and of course the first thing the poor guy had to do was to try and fix some bugs, so he could get to know the codebase.
In the evening there was just him and me sitting at our desks and he came up to me asking me if I could tell why his breakpoint wasn’t getting hit. Unfortunately I didn’t know anything about that piece of code either. But the guy had a really rough day with a bunch of serious issues in his private life, so I really wanted to help him out (well I would’ve helped anyway :-))

issues
So we checked which paths led to the method in question, to try and see where we took the wrong exit. As you might guess this method got called in a gazillion ways and we didn’t have the time to start digging.
So I fired up codetrack using the timeline option. Within 2 minutes we found the reason why the breakpoint wasn’t hit.  I didn’t fix all of his problems, but at least there was one less on the list. (btw: luckily all of his other problems are solved too)

The one where you want to know how they do it

Sometimes you see a cool piece of .NET software and you’re really curious how they made it. Or you have to get familiar with a new codebase.
Of course there are great tools like Ilspy, dotpeek, reflector and lots of others which let you easily peek into the code.

curious-cat_o_122046
And that’s a great start. However sometimes it would be easier if you also could see what the execution flow of the code is or what arguments are passed to a method.
Also here codetrack can assist you and save you some time. (btw the Ilspy package is also used in codetrack and shows you the code as you select a call)

The one where the debugger fixes your problem

Sometimes you’ve got this problem and when you attach the debugger, all of a sudden everything runs just fine.

a2564ad916ed5720782856aa623771698e45c18d28b9d2feda1dd84988452cdd

This might be because the debugger slightly alters the timing of your method calls, hiding the issue for example.
Well depending on the level of detail you select in your options, Codetrack might just be faster and still give you the information you need…

I used to do a lot of WPF stuff and some of the tricky things to debug is what happens when for instance a combobox gets expanded or closed. If you try putting a breakpoint in your code, your ui loses focus and you get a completely diffferent behavior.  This is also a situation where codetrack can come in really handy !

Let me know when Codetrack made your day

There are probably tons of other examples or situations where Codetrack can make your developer life easier. And I’m pretty sure  lots of handy features are just around the corner 😉

Oh and did I already mention it’s completely FREE ????

image

Get the latest version of Codetrack at http://www.getcodetrack.com

I’m really curious about your own Codetrack adventures, so don’t hesitate to share them with me !


.NET Core now supported

.NET Core is now included in the profiling types!

I just tested it by creating a hello world console app, and created a webapi and mvc project. All seemed to work on my machine.
I did not have the chance (read: the time) to create real .NET Core projects. So this is were I’m asking for your help: please test it on your own projects and let me know if it all works or if there are any issues. I’ll be happy to help you out or to fix stuff, but I can only do this if you keep mee posted. So pretty please with sugar on the top, tell me about your .NET core adventures in Codetrack.

c5d5b517c9a526eb953dd4fd121667040b3512959c8de616ec8f2f01190d3540
Actually this goes for all other usage of Codetrack as well: often stuff works on my machine, however there’s always this one user with the right/wrong combination of OS, FW and what not 🙂

Make sure to check out the HOW TO

Happy profiling !


coreclr01

Welcome

Welcome to the codetrack blog. Make sure to subscribe to the RSS feed of this blog. All new releases will be posted here!